// @passiontrader
_SECTION_BEGIN("Head and Shoulder");
// Bullish + Bearish Head and Shoulder pattern
SetOption("MaxOpenPositions",10);
PositionSize=-5;
SetTradeDelays(0,0,0,0);
procedure exitLoop_proc(Buy,BuyPrice,buDeltaProfitTarget,buStopLossLevel,buNeckline,Short,ShortPrice,beDeltaProfitTarget,beStopLossLevel,beNeckline,Maxbars)
{
global BuyAdjusted;
global BuyPriceAdjusted;
global ShortAdjusted;
global ShortPriceAdjusted;
global SellAdjusted;
global SellPriceAdjusted;
global CoverAdjusted;
global CoverPriceAdjusted;
global LongStopTrail;
global ShortStopTrail;
global LongTarget;
global ShortTarget;
BuyAdjusted=0;
BuyPriceAdjusted=0;
ShortAdjusted=0;
ShortPriceAdjusted=0;
SellAdjusted=0;
SellPriceAdjusted=0;
CoverAdjusted=0;
CoverPriceAdjusted=0;
LongStopTrail=Null;
ShortStopTrail=Null;
LongTarget=Null;
ShortTarget=Null;
for(i=1;i<BarCount;i++)
{
if(Buy[i])
{
BuyAdjusted[i]=1;
BuyPriceAdjusted[i]=BuyPrice[i];
LongStopTrail[i]=buStopLossLevel[i];
LongTarget[i]=buNeckline[i]+buDeltaProfitTarget[i];
cnt=0;
for(j=i+1;j<BarCount;j++)
{
LongStopTrail[j]=LongStopTrail[i];
LongTarget[j]=LongTarget[i];
if(cnt>Maxbars)
{
SellAdjusted[j]=1;
SellPriceAdjusted[j]=O[j];
i=j;
break;
}
else if(C[j-1]<LongStopTrail[j-1])
{
SellAdjusted[j]=1;
SellPriceAdjusted[j]=O[j];
i=j;
break;
}
else if(Short[j])
{
SellAdjusted[j]=1;
SellPriceAdjusted[j]=O[j];
i=j-1;
break;
}
else if(C[j-1]>LongTarget[j-1])
{
SellAdjusted[j]=1;
SellPriceAdjusted[j]=O[j];
i=j;
break;
}
else if(j==BarCount-1)
{
i=BarCount;
break;
}
cnt=cnt+1;
}
}
else if(Short[i])
{
ShortAdjusted[i]=1;
ShortPriceAdjusted[i]=ShortPrice[i];
ShortStopTrail[i]=beStopLossLevel[i];
ShortTarget[i]=beNeckline[i]-beDeltaProfitTarget[i];
cnt=0;
for(j=i+1;j<BarCount;j++)
{
ShortStopTrail[j]=ShortStopTrail[i];
ShortTarget[j]=ShortTarget[i];
if(cnt>Maxbars)
{
CoverAdjusted[j]=1;
CoverPriceAdjusted[j]=O[j];
i=j;
break;
}
else if(C[j-1]>ShortStopTrail[j-1])
{
CoverAdjusted[j]=1;
CoverPriceAdjusted[j]=O[j];
i=j;
break;
}
else if(Buy[j])
{
CoverAdjusted[j]=1;
CoverPriceAdjusted[j]=O[j];
i=j-1;
break;
}
else if(C[j-1]<ShortTarget[j-1])
{
CoverAdjusted[j]=1;
CoverPriceAdjusted[j]=O[j];
i=j;
break;
}
else if(j==BarCount-1)
{
i=BarCount;
break;
}
cnt=cnt+1;
}
}
}
}
xx=BarIndex();x=xx;Lx=LastValue(x);
nbar=Param("N Pivot Bars",2,2,50,1);
tf=Param("Time Frame (min)",5,0.001,1440,0.001);tfrm=in1Minute*tf;
atrper=Param("ATR Period (bars)",20,2,100,1);
atrfac1=Param("ATR tolerance factor (Shoulders)",2.25,0,50,0.01);
atrfac2=Param("ATR tolerance factor (Head Minimum)",0.4,0,50,0.01);
atrfac3=Param("ATR tolerance factor (Head Maximum)",5,0,50,0.01);
CleanPivots=ParamToggle("Use Clean Pivots","Off|On",1);
PivotSymmetry=ParamToggle("Use Symmetric Pivots","Off|On",0);
dispbeHS=ParamToggle("Display bearish HS","Off|On",1);
dispbuHS=ParamToggle("Display bullish HS","Off|On",1);
extendN=Param("Extension neckline (bars)",100,0,500,1);
validSignalRangeCheck=ParamToggle("Signal Validity Range Check","Off|On",1);
hssym=Param("Max Deviation H&S Symmetry (%)",80,0,500,1);
includeVolumeSlope=ParamToggle("Volume Slope Constraint","Off|On",0);
Maxbars=Param("Maximum bars of trade",50,2,200,1);
TimeFrameSet(tfrm);
atra=ATR(atrper);
if(PivotSymmetry)
{
fc=1;
pk=H>Ref(HHV(H,nbar*fc),-1) AND Ref(HHV(H,nbar),nbar)<=H;
tr=L<Ref(LLV(L,nbar*fc),-1) AND Ref(LLV(L,nbar),nbar)>=L;
}
else
{
fc=2;
pk=H>Ref(HHV(H,nbar*fc),-1) AND Ref(HHV(H,nbar),nbar)<=H;
tr=L<Ref(LLV(L,nbar*fc),-1) AND Ref(LLV(L,nbar),nbar)>=L;
}
px0=ValueWhen(pk,x,0); tx0=ValueWhen(tr,x,0);
px1=ValueWhen(pk,x,1); tx1=ValueWhen(tr,x,1);
px2=ValueWhen(pk,x,2); tx2=ValueWhen(tr,x,2);
px3=ValueWhen(pk,x,3); tx3=ValueWhen(tr,x,3);
ph0=ValueWhen(pk,H,0); tl0=ValueWhen(tr,L,0);
ph1=ValueWhen(pk,H,1); tl1=ValueWhen(tr,L,1);
ph2=ValueWhen(pk,H,2); tl2=ValueWhen(tr,L,2);
ph3=ValueWhen(pk,H,3); tl3=ValueWhen(tr,L,3);
if(CleanPivots)
{
tr=IIf((tr==1 AND pk==1) AND px2<tx2,False,tr);
pk=IIf((tr==1 AND pk==1) AND px2>tx2,False,pk);
px0=ValueWhen(pk,x,0); tx0=ValueWhen(tr,x,0);
px1=ValueWhen(pk,x,1); tx1=ValueWhen(tr,x,1);
px2=ValueWhen(pk,x,2); tx2=ValueWhen(tr,x,2);
px3=ValueWhen(pk,x,3); tx3=ValueWhen(tr,x,3);
ph0=ValueWhen(pk,H,0); tl0=ValueWhen(tr,L,0);
ph1=ValueWhen(pk,H,1); tl1=ValueWhen(tr,L,1);
ph2=ValueWhen(pk,H,2); tl2=ValueWhen(tr,L,2);
ph3=ValueWhen(pk,H,3); tl3=ValueWhen(tr,L,3);
tr=IIf(tr AND ((tx0<px0 AND tl1>tl0) OR (tx2>px1 AND tl1>=tl2) OR (px0==px1 AND tl1>tl0)),False,tr);
pk=IIf(pk AND ((px0<tx0 AND ph1<ph0) OR (px2>tx1 AND ph1<=ph2) OR (tx0==tx1 AND ph1<ph0)),False,pk);
px0=ValueWhen(pk,x,0); tx0=ValueWhen(tr,x,0);
px1=ValueWhen(pk,x,1); tx1=ValueWhen(tr,x,1);
px2=ValueWhen(pk,x,2); tx2=ValueWhen(tr,x,2);
px3=ValueWhen(pk,x,3); tx3=ValueWhen(tr,x,3);
ph0=ValueWhen(pk,H,0); tl0=ValueWhen(tr,L,0);
ph1=ValueWhen(pk,H,1); tl1=ValueWhen(tr,L,1);
ph2=ValueWhen(pk,H,2); tl2=ValueWhen(tr,L,2);
ph3=ValueWhen(pk,H,3); tl3=ValueWhen(tr,L,3);
}
pkh=IIf(pk,H,Null);
trl=IIf(tr,L,Null);
TimeFrameRestore();
fact=Nz(Max(tfrm/60,Interval()/60)/(Interval()/60));
if(fact==0)fact=1;
Lkbk=tfrm/Interval();
if(Lkbk>1 AND !IsNan(Lkbk))
{
pk=TimeFrameExpand(pk,tfrm,expandFirst);
pkh=TimeFrameExpand(pkh,tfrm,expandFirst);
pkhs=IIf(!IsEmpty(pkh),1,0);pkhs=pkhs-Ref(pkhs,-1);
pk=pk AND H==pkh;
cond1=Sum(pk,BarsSince(pkhs==1)+1)==1 AND pk;
pk=pk AND cond1;
tr=TimeFrameExpand(tr,tfrm,expandFirst);
trl=TimeFrameExpand(trl,tfrm,expandFirst);
trls=IIf(!IsEmpty(trl),1,0);trls=trls-Ref(trls,-1);
tr=tr AND L==trl;
cond1=Sum(tr,BarsSince(trls==1)+1)==1 AND tr;
tr=tr AND cond1;
px0=ValueWhen(pk,x,0); tx0=ValueWhen(tr,x,0);
px1=ValueWhen(pk,x,1); tx1=ValueWhen(tr,x,1);
px2=ValueWhen(pk,x,2); tx2=ValueWhen(tr,x,2);
px3=ValueWhen(pk,x,3); tx3=ValueWhen(tr,x,3);
ph0=ValueWhen(pk,H,0); tl0=ValueWhen(tr,L,0);
ph1=ValueWhen(pk,H,1); tl1=ValueWhen(tr,L,1);
ph2=ValueWhen(pk,H,2); tl2=ValueWhen(tr,L,2);
ph3=ValueWhen(pk,H,3); tl3=ValueWhen(tr,L,3);
atra=TimeFrameExpand(atra,tfrm,expandFirst);
}
ll=tr AND tl1<tl2;
hl=tr AND tl1>tl2;
hh=pk AND ph1>ph2;
lh=pk AND ph1<ph2;
dt=pk AND ph1==ph2;
db=tr AND tl1==tl2;
ll_h=IIf(ll,1,0);
hl_h=IIf(hl,2,0);
hh_h=IIf(hh,3,0);
lh_h=IIf(lh,4,0);
dt_h=IIf(dt,5,0);
db_h=IIf(db,6,0);
combi=ll_h+hl_h+lh_h+hh_h+dt_h+db_h;
t0=ValueWhen(combi,combi,0);
t1=ValueWhen(combi,combi,1);
t2=ValueWhen(combi,combi,2);
t3=ValueWhen(combi,combi,3);
t4=ValueWhen(combi,combi,4);
t5=ValueWhen(combi,combi,5);
// bearisch pattern
beHS=pk AND t1==4 AND (t2==1 OR t2==2) AND t3==3 AND t4==2 AND (t5==3 OR t5==4)
AND abs(tl1-tl2)<atra*atrfac1 AND abs(ph1-ph3)<atra*atrfac1 AND ph2>(Max(ph1,ph3)+atra*atrfac2) AND ph2<(Max(ph1,ph3)+atra*atrfac3);
beAx=ValueWhen(beHS,px3);beAy=ValueWhen(beHS,ph3);
beBx=ValueWhen(beHS,tx2);beBy=ValueWhen(beHS,tl2);
beCx=ValueWhen(beHS,px2);beCy=ValueWhen(beHS,ph2);
beDx=ValueWhen(beHS,tx1);beDy=ValueWhen(beHS,tl1);
beEx=ValueWhen(beHS,px1);beEy=ValueWhen(beHS,ph1);
beFx=ValueWhen(beHS,px1);aa=(beDy-beBy)/(beDx-beBx);bb=beDy;ii=px1-beDx;beFy=aa*ii+bb;
beHS=beHS AND 100*abs((beCx-beAx)-(beEx-beCx))/(Min(beCx-beAx,beEx-beCx)+1)<hssym;
if(includeVolumeSlope) beHS=IIf(beHS AND LinRegSlope(V,beEx-beAx)<0,beHS,0);
rr=BarsSince(beHS)>=0 AND BarsSince(beHS)<extendN;
idx=IIf(rr,xx-ValueWhen(beHS,beDx),Null);
aa=ValueWhen(beHS,aa);bb=ValueWhen(beHS,bb);
beNeckline=IIf(idx,aa*idx+bb,Null);
beValidSignalArea=Ref(Flip(Ref(beHS,-1),pk),1);
if(validSignalRangeCheck) beNeckline=IIf(beValidSignalArea,beNeckline,Null);
beGx=beCx;beGy=beBy+(beDy-beBy)/(beDx-beBx)*(beCx-beBx);
Short=Cross(beNeckline,C) AND !IsEmpty(beNeckline);Short=Ref(Short,-1);ShortPrice=O;
Short=ExRem(Short,beHS);beDeltaProfitTarget=beCy-beGy;beStopLossLevel=beEy;
// bullish pattern
buHS=tr AND t1==2 AND (t2==3 OR t2==4) AND t3==1 AND t4==4 AND (t5==1 OR t5==2)
AND abs(ph1-ph2)<atra*atrfac1 AND abs(tl1-tl3)<atra*atrfac1 AND tl2<(Max(tl1,tl3)-atra*atrfac2) AND tl2>(Max(tl1,tl3)-atra*atrfac3);
buAx=ValueWhen(buHS,tx3);buAy=ValueWhen(buHS,tl3);
buBx=ValueWhen(buHS,px2);buBy=ValueWhen(buHS,ph2);
buCx=ValueWhen(buHS,tx2);buCy=ValueWhen(buHS,tl2);
buDx=ValueWhen(buHS,px1);buDy=ValueWhen(buHS,ph1);
buEx=ValueWhen(buHS,tx1);buEy=ValueWhen(buHS,tl1);
buFx=ValueWhen(buHS,tx1);aa=(buDy-buBy)/(buDx-buBx);bb=buDy;ii=tx1-buDx;buFy=aa*ii+bb;
buHS=buHS AND 100*abs((buCx-buAx)-(buEx-buCx))/(Min(buCx-buAx,buEx-buCx)+1)<hssym;
if(includeVolumeSlope) buHS=IIf(buHS AND LinRegSlope(V,buEx-buAx)<0,buHS,0);
rr=BarsSince(buHS)>=0 AND BarsSince(buHS)<extendN;
idx=IIf(rr,xx-ValueWhen(buHS,buDx),Null);
aa=ValueWhen(buHS,aa);bb=ValueWhen(buHS,bb);
buNeckline=IIf(idx,aa*idx+bb,Null);
buValidSignalArea=Ref(Flip(Ref(buHS,-1),tr),1);
if(validSignalRangeCheck) buNeckline=IIf(buValidSignalArea,buNeckline,Null);
buGx=buCx;buGy=buBy+(buDy-buBy)/(buDx-buBx)*(buCx-buBx);
Buy=Cross(C,buNeckline) AND !IsEmpty(buNeckline);Buy=Ref(Buy,-1);BuyPrice=O;
Buy=ExRem(Buy,buHS);buDeltaProfitTarget=buGy-buCy;buStopLossLevel=buEy;
exitLoop_proc(Buy,BuyPrice,buDeltaProfitTarget,buStopLossLevel,buNeckline,Short,ShortPrice,beDeltaProfitTarget,beStopLossLevel,beNeckline,Maxbars);
Buy=BuyAdjusted;BuyPrice=BuyPriceAdjusted;
Short=ShortAdjusted;ShortPrice=ShortPriceAdjusted;
Sell=SellAdjusted;SellPrice=SellPriceAdjusted;
Cover=CoverAdjusted;CoverPrice=CoverPriceAdjusted;
SetChartBkColor(ColorRGB(0,0,0));SetChartOptions(0,chartShowDates);
SetBarFillColor(IIf(C>O,colorGreen,IIf(C<=O,colorRed,colorLightGrey)));
Plot(C,"Price",IIf(C>O,colorDarkGreen,IIf(C<=O,colorDarkRed,colorLightGrey)),64,0,0,0,0);
Plot(pkh,"",colorRed,styleThick,0,0,0,-1);
Plot(trl,"",colorBrightGreen,styleThick,0,0,0,-1);
PlotShapes(shapeSmallCircle*tr,IIf(Lx-ValueWhen(tr,x)>nbar*fact,ColorRGB(0,100,0),colorWhite),0,L,-10);
PlotShapes(shapeSmallCircle*pk,IIf(Lx-ValueWhen(pk,x)>nbar*fact,ColorRGB(255,0,0),colorWhite),0,H,10);
if(dispbuHS)
{
Plot(buNeckline,"",colorAqua,styleNoLine|styleDots,0,0,0,1);
PlotShapes(IIf(Buy,shapeUpArrow,shapeNone),colorDarkGreen,0,L,-15);
PlotShapes(IIf(Buy,shapeSmallCircle,shapeNone),colorWhite,0,BuyPrice,0);
PlotShapes(IIf(Sell,shapeDownArrow,shapeNone),colorRed,0,H,-15);
PlotShapes(IIf(Sell,shapeSmallCircle,shapeNone),colorWhite,0,SellPrice,0);
Plot(LongStopTrail,"",colorRed,styleLine,0,0,1,1);
Plot(LongTarget,"",colorBrightGreen,styleLine,0,0,1,1);
}
if(dispbeHS)
{
Plot(beNeckline,"",colorYellow,styleNoLine|styleDots,0,00,0,1);
PlotShapes(IIf(Short,shapeSmallDownTriangle,shapeNone),colorRed,0,H,IIf(Short AND Sell,-30,-15));
PlotShapes(IIf(Short,shapeSmallCircle,shapeNone),colorWhite,0,ShortPrice,0);
PlotShapes(IIf(Cover,shapeSmallUpTriangle,shapeNone),colorDarkGreen,0,L,IIf(Cover AND Buy,-30,-15));
PlotShapes(IIf(Cover,shapeSmallCircle,shapeNone),colorWhite,0,CoverPrice,0);
Plot(ShortStopTrail,"",colorGreen,styleLine,0,00,1,1);
Plot(ShortTarget,"",colorBrightGreen,styleLine,0,00,1,1);
}
qq=Interval()/60;
if(qq < 60){tf=" min";tt=qq;}
else if(qq >= 60 AND qq < 1440){tf=" hrs";tt=qq/60;}
else if(qq >= 1440){tf=" days";tt=(qq/60)/24;}
qq=Max(tfrm/60,Interval()/60);
if(qq < 60){tfa=" min";tta=qq;}
else if(qq >= 60 AND qq < 1440){tfa=" hrs";tta=qq/60;}
else if(qq >= 1440){tfa=" days";tta=(qq/60)/24;}
Title = Name() +
"\nNbar: " + nbar +
"\nChart TF: " + tt + tf +
"\nTrend TF: " + tta + tfa;
abcdy_up=20;
abcdy_dn=28;
function GetVisibleBarCount()
{
lvb=Status("lastvisiblebar");
fvb=Status("firstvisiblebar");
return Min(lvb-fvb,BarCount-fvb);
}
function GfxConvertPixelsToBarX(Pixels)
{
lvb=Status("lastvisiblebar");
fvb=Status("firstvisiblebar");
pxchartleft=Status("pxchartleft");
pxchartwidth=Status("pxchartwidth");
fac=pxchartwidth/Pixels;
bar=(lvb-fvb)/fac;
return bar;
}
function GfxConvertPixelToValueY(Pixels)
{
local Miny,Maxy,pxchartbottom,pxchartheight;
Miny=Status("axisminy");
Maxy=Status("axismaxy");
pxchartbottom=Status("pxchartbottom");
pxchartheight=Status("pxchartheight");
fac=pxchartheight/Pixels;
Value=(Maxy-Miny)/fac;
return Value;
}
AllVisibleBars=GetVisibleBarCount();
fvb=Status("firstvisiblebar");
abcdy_up=GfxConvertPixelToValueY(abcdy_up);
abcdy_dn=GfxConvertPixelToValueY(abcdy_dn);
for(i=0;i<AllVisibleBars;i++)
{
if(beHS[i+fvb] AND dispbeHS)
{
clr=colorRed;
lvix=i+fvb;
Plot(LineArray(beAx[lvix],beAy[lvix],beBx[lvix],beBy[lvix],0,True ),"",clr,styleThick);
Plot(LineArray(beBx[lvix],beBy[lvix],beCx[lvix],beCy[lvix],0,True ),"",clr,styleThick);
Plot(LineArray(beCx[lvix],beCy[lvix],beDx[lvix],beDy[lvix],0,True ),"",clr,styleThick);
Plot(LineArray(beDx[lvix],beDy[lvix],beEx[lvix],beEy[lvix],0,True ),"",clr,styleThick);
Plot(LineArray(beDx[lvix],beDy[lvix],beFx[lvix],beFy[lvix],0,True ),"",clr,styleDashed);
Plot(LineArray(beBx[lvix],beBy[lvix],beDx[lvix],beDy[lvix],0,True ),"",clr,styleDashed);
PlotText("S1",beAx[lvix]-0,beAy[lvix]+abcdy_up,colorRed,colorDefault);
PlotText("H",beCx[lvix]-0,beCy[lvix]+abcdy_up,colorRed,colorDefault);
PlotText("S2",beEx[lvix]-0,beEy[lvix]+abcdy_up,colorRed,colorDefault);
}
if(buHS[i+fvb] AND dispbuHS)
{
clr=colorGreen;
lvix=i+fvb;
Plot(LineArray(buAx[lvix],buAy[lvix],buBx[lvix],buBy[lvix],0,True ),"",clr,styleThick);
Plot(LineArray(buBx[lvix],buBy[lvix],buCx[lvix],buCy[lvix],0,True ),"",clr,styleThick);
Plot(LineArray(buCx[lvix],buCy[lvix],buDx[lvix],buDy[lvix],0,True ),"",clr,styleThick);
Plot(LineArray(buDx[lvix],buDy[lvix],buEx[lvix],buEy[lvix],0,True ),"",clr,styleThick);
Plot(LineArray(buDx[lvix],buDy[lvix],buFx[lvix],buFy[lvix],0,True ),"",clr,styleDashed);
Plot(LineArray(buBx[lvix],buBy[lvix],buDx[lvix],buDy[lvix],0,True ),"",clr,styleDashed);
PlotText("S1",buAx[lvix]-0,buAy[lvix]-abcdy_dn,colorGreen,colorDefault);
PlotText("H",buCx[lvix]-0,buCy[lvix]-abcdy_dn,colorGreen,colorDefault);
PlotText("S2",buEx[lvix]-0,buEy[lvix]-abcdy_dn,colorGreen,colorDefault);
}
}
_SECTION_END();
// Downloaded From https://www.WiseStockTrader.com
_SECTION_BEGIN("DBDT");
GraphXSpace = 5;
SetChartBkColor( colorBlack );
SetChartOptions( 1, chartShowDates, chartGridMiddle, 0, 0, 0 );
SetChartOptions(0,chartShowArrows|chartShowDates);
SetBarFillColor( IIf( C > O, ColorRGB( 0, 75, 0 ), IIf( C <= O, ColorRGB( 75, 0, 0 ), colorLightGrey ) ) );
_SECTION_BEGIN("Title");
DODay = TimeFrameGetPrice("O", inDaily);
DHiDay = TimeFrameGetPrice("H", inDaily);
DLoDay = TimeFrameGetPrice("L", inDaily);
Title = EncodeColor(colorWhite)+ Name() + ", " + EncodeColor(colorGold)+ Interval(2) + ", " + EncodeColor(colorAqua)+Date() + EncodeColor(colorWhite)+" - " +
EncodeColor(colorYellow) + "Vol: "+ WriteVal(V) +
EncodeColor(colorBlue) + " Open: " + EncodeColor(colorWhite) + O +
EncodeColor(colorRed)+ " High: " +EncodeColor(colorWhite) + H +
EncodeColor(colorBrightGreen)+ " Low: " +EncodeColor(colorWhite) + L +
EncodeColor(colorTeal) +" Close: " + EncodeColor(colorWhite) +C +
EncodeColor(colorBlue)+ " Day-Open: " +DODay + EncodeColor(colorBrightGreen)+" Day-High: " +DHiDay +EncodeColor(colorRed)+ " Day-Low: " + DLoDay;
_SECTION_END();
Plot( C, "", IIf( C > O, ColorRGB( 0, 255, 0 ), IIf( C <= O, ColorRGB( 255, 0, 0 ), colorLightGrey ) ), 64, Null, Null, 0, 0, 1 );
// Fractal Pivots, E.M.Pottasch 2/2018
bi = BarIndex();
fvb = FirstVisibleValue( bi );
lvb = LastVisibleValue( bi );
rightstrength = Param( "Right Strength", 1, 1, 50, 1 );
leftstrength = Param( "Left Strength", 1, 1, 50, 1 );
fact = Param( "Chart Time Frame Factor", 2, 1, 10, 1 );
rightStrength = rightStrength * fact;
leftStrength = leftStrength * fact;
pk = H == HHV( H, leftstrength ) AND Ref( HHV( H, rightstrength ), rightstrength ) < H;
tr = L == LLV( L, leftstrength ) AND Ref( LLV( L, rightstrength ), rightstrength ) > L;
pkl = H == HHV( H, leftstrength );
trl = L == LLV( L, leftstrength );
for( i = 0; i < 3; i++ )
{
VarSet( "px" + i, ValueWhen( pk, bi, i ) );
VarSet( "tx" + i, ValueWhen( tr, bi, i ) );
VarSet( "ph" + i, ValueWhen( pk, H, i ) );
VarSet( "tl" + i, ValueWhen( tr, L, i ) );
}
ll = tr AND tl1 < tl2;
hl = tr AND tl1 > tl2;
hh = pk AND ph1 > ph2;
lh = pk AND ph1 < ph2;
dt = pk AND ph1 == ph2;
db = tr AND tl1 == tl2;
//PlotShapes( shapeSmallCircle * trl, ColorRGB( 80, 0, 0 ), 0, L, -10 );
//PlotShapes( shapeSmallCircle * pkl, ColorRGB( 0, 80, 0 ), 0, H, 10 );
//PlotShapes( shapeSmallCircle * tr, ColorRGB( 0, 255, 0 ), 0, L, -10 );
//PlotShapes( shapeSmallCircle * pk, ColorRGB( 255, 0, 0 ), 0, H, 10 );
doubleTopThreshold = 0.75 * Ref( ATR( 20 ), -1 );
doubleTop = pk && abs( ph1 - ph2 ) < doubleTopThreshold;
doubleBottomThreshold = 0.75 * Ref( ATR( 20 ), -1 );
doubleBottom = tr && abs( tl1 - tl2 ) < doubleBottomThreshold;
for( i = lvb; i > fvb; i-- )
{
sz = 8;
if( doubleTop[i] )
{
str = "DT";
PlotTextSetFont( str, "Arial Black", sz, i, H[i], ColorRGB( 250, 125, 0 ), colorGrey40, 40 );
}
if( doubleBottom[i] )
{
str = "DB";
PlotTextSetFont( str, "Arial Black", sz, i, L[i], ColorRGB( 250, 125, 0 ), colorWhite, -40 );
}
}
writeif( highest( doubleTop ) == 1, "\nAmiBroker has detected some possible Double Top patterns for " + name() + "\n\nLook for TAG on the price chart.", "\n\nThere are no double top patterns for " + name() );
writeif( highest( doubleBottom ) == 1, "\n\nAmiBroker has detected some possible Double Bottom patterns for " + name() + "\n\nLook for TAG on the price chart.", "\nThere are no double top patterns for " + name() );
_SECTION_END();
riskAmount=Param("Risk Amount",25,10,10000,5);
Limit=Param(" Trade Till (Hour)(Min)(Sec)",145900,103000,153000,100);
since=(TimeNum() >= 101459 AND TimeNum()<= Limit) AND (DateNum()==LastValue(DateNum()));
_SECTION_BEGIN("Alerts");
SRbS = ParamToggle("S/R broken","Off,On",1);
SRcS = ParamToggle("S/R confirmed","Off,On",1);
PjabS = ParamToggle("Price just above/below","Off,On",1);
_SECTION_END();
_SECTION_BEGIN("Main Parameters");
PlotP1P2 = ParamToggle("Plot P1/P2 Shapes","Off,On",1);
P1Shape = Param("P1 Shape Typ",35,0,50,1);//default 35
P2Shape = Param("P2 Shape Typ",37,0,50,1);//default 37
Parallellinesswitch = ParamToggle("Plot Parallel Lines","Off,On",1);
DisRange = Param("Plot Parallel Lines Trigger",300,0,1000,20);
_SECTION_BEGIN("Styles");
Style_SL= ParamStyle("Support",styleLine+styleThick,maskDefault)+styleNoRescale;
Style_RL= ParamStyle("Resistance",styleLine+styleThick,maskDefault)+styleNoRescale;
Style_PHL= ParamStyle("Parallel Support",styleLine+styleDashed,maskDefault)+styleNoRescale;
Style_PLL= ParamStyle("Parallel Resistance",styleLine+styleDashed,maskDefault)+styleNoRescale;
_SECTION_END();
_SECTION_BEGIN("Colors");
Color_SL= ParamColor("Support",colorLime);
Color_RL= ParamColor("Resistance",colorRed);
Shadowcolor = ParamColor("Shadow",ColorRGB(56,63,118));
if(Version()<4.75){Backgroundcolor = ParamColor("Your Background",colorBlack);}
Color_PLL= Color_RL; //ParamColor("Resistance",colorRed);
Color_PHL= Color_SL; //ParamColor("Support",colorLime);
_SECTION_END();
_SECTION_BEGIN("Pattern Selection");
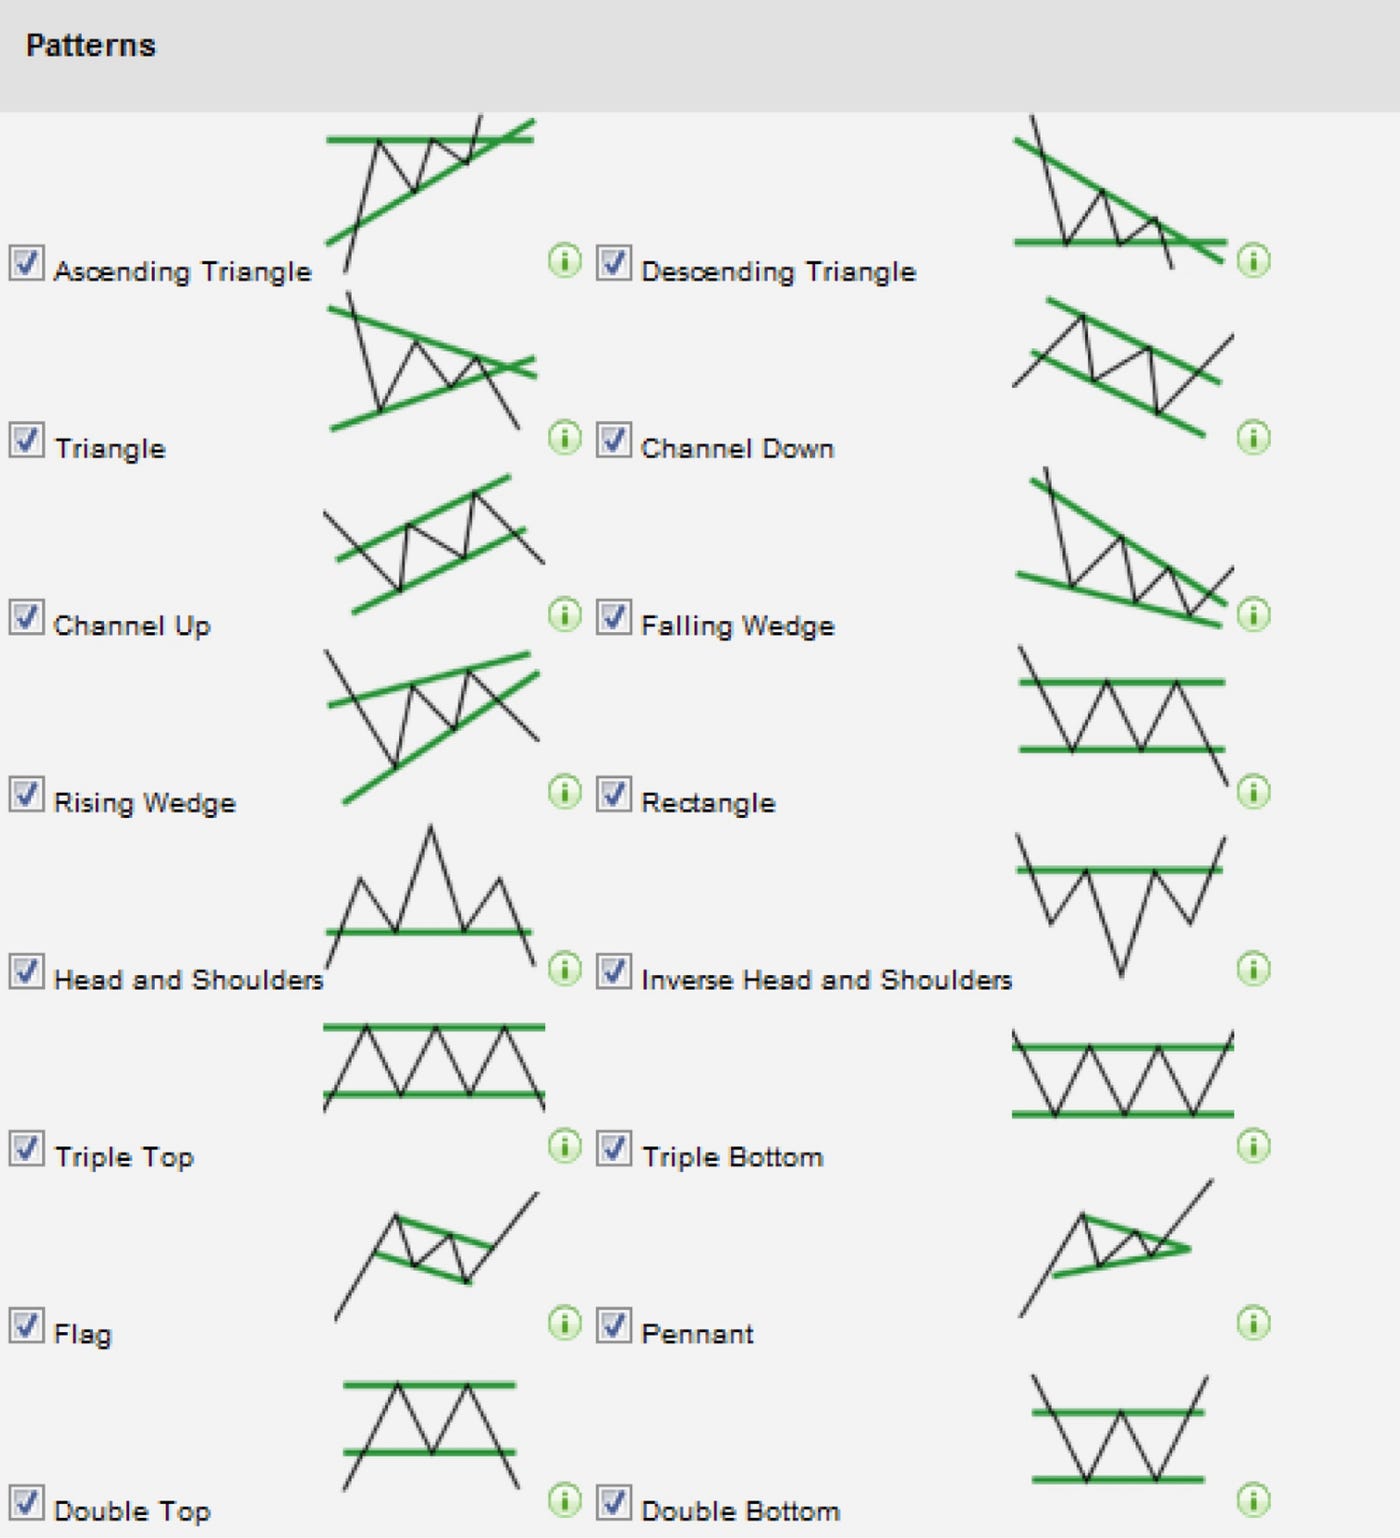
AscTs = ParamToggle("Ascending Triangle","Off,On",1);
DscTs = ParamToggle("Descending Triangle","Off,On",1);
STs = ParamToggle("Symmetrically Triangle","Off,On",1);
ETs = ParamToggle("Expanding Triangle","Off,On",1);
RWs = ParamToggle("Rising Wedge","Off,On",1);
FWs = ParamToggle("Falling Wedge","Off,On",1);
UTs = ParamToggle("Up Trend","Off,On",1);
DTs = ParamToggle("Down Trend","Off,On",1);
Ranges = ParamToggle("Range","Off,On",1);
NonDefinedPatterns = ParamToggle("Not defined Patterns","Off,On",1);
_SECTION_END();
//calcs
HH = HHV(H,20);
LL = LLV(L,20);
Mid = LL+((HH-LL)/2);
Div = 100-(HH/(0.01*Mid));
Per = LastValue(abs(Div));
Hp1 = Ref(H,-1);Hp2 = Ref(H,-2);Hp3 = Ref(H,-3);Hp4 = Ref(H,-4);Hp5 = Ref(H,-5);Hp6 = Ref(H,-6);
Lp1 = Ref(L,-1);Lp2 = Ref(L,-2);Lp3 = Ref(L,-3);Lp4 = Ref(L,-4);Lp5 = Ref(L,-5);Lp6 = Ref(L,-6);
Hf1 = Ref(H,1);Hf2 = Ref(H,2);Hf3 = Ref(H,3);Hf4 = Ref(H,4);Hf5 = Ref(H,5);Hf6 = Ref(H,6);
Lf1 = Ref(L,1);Lf2 = Ref(L,2);Lf3 = Ref(L,3);Lf4 = Ref(L,4);Lf5 = Ref(L,5);Lf6 = Ref(L,6);
x = Cum(1);
divx = LastValue(x)-x;
//Tops
A = H;
Top1 = A > Hf2 & A > Hf1 & A > Hp1 & A > Hp2 & divx>2;
Top2 = A > Hf3 & A > Hf2 & A ==Hf1 & A > Hp1 & A > Hp2 & divx>3 ;
Top3 = A > Hf4 & A > Hf3 & A ==Hf2 & A >=Hf1 & A > Hp1 & A > Hp2 & divx>4;
Top4 = A > Hf5 & A > Hf4 & A ==Hf3 & A >=Hf2 & A >=Hf1 & A > Hp1 & A > Hp2 & divx>5;
Top5 = A > Hf6 & A > Hf5 & A ==Hf4 & A >=Hf3 & A ==Hf2 & A >=Hf1 & A > Hp1 & A >Hp2 & divx>6;
Top = Top1 OR Top2 OR Top3 OR Top4 OR Top5;
TopHigh = ValueWhen(Top,H);
TopX = ValueWhen(Top,X);
//Valleys
A = L;
Valley1 = A < Lf2 & A <= Lf1 & A <= Lp1 & A < Lp2 & divx>2;
Valley2 = A < Lf3 & A < Lf2 & A == Lf1 & A < Lp1 & A < Lp2 & divx>3;
Valley3 = A < Lf4 & A < Lf3 & A == Lf2 & A <= Lf1 & A < Lp1 & A < Lp2 & divx>4;
Valley4 = A < Lf5 & A < Lf4 & A == Lf3 & A <= Lf2 & A <= Lf1 & A < Lp1 & A < Lp2 & divx>5;
Valley5 = A < Lf6 & A < Lf5 & A == Lf4 & A <= Lf3 & A == Lf2 & A <= Lf1 & A < Lp1 & A < Lp2 & divx>6;
Valley = Valley1 OR Valley2 OR Valley3 OR Valley4 OR Valley4 OR Valley5;
ValleyLow = ValueWhen(Valley,L);
ValleyX = ValueWhen(Valley,X);
x = Cum(1);
xb = LastValue(ValueWhen(Valley,x,1));
xa = LastValue(ValueWhen(Valley,x,2));
yb = LastValue(ValueWhen(Valley,L,1));
Ya = LastValue(ValueWhen(Valley,L,2));
xab_log = log(yb/yA)/(xb-xa);
SL = exp((x-xb)*xab_log)*yb;
RocSL = ROC(SL,1);
xd = LastValue(ValueWhen(top,x,1));
xc = LastValue(ValueWhen(top,x,2));
yd = LastValue(ValueWhen(top,H,1));
Yc = LastValue(ValueWhen(top,H,2));
xcd_log = log(yd/yc)/(xd-xc);
RL = exp((x-xd)*xcd_log)*yd;
RocRL = ROC(RL,1);
//LPL
Low_Value = LastValue(Ref(LLV(L,xd-xc),-(x-xd)));
x2 = LastValue(ValueWhen(L==Low_Value & x>xc & x<xd,x));
PLL = IIf(LastValue(x)-x2>5,exp((x-x2)*xcd_log)*Low_Value,-1e10);
//HPL
Hi_Value = LastValue(Ref(HHV(H,xb-xa),-(x-xb)));
x3 = LastValue(ValueWhen(H==Hi_Value & x>xa & x<xb,x));
PHL = IIf(LastValue(x)-x3>5,exp((x-x3)*xab_log)*Hi_Value,-1e10);
//Channels
AvgRoc = abs(MA(ROC(C,1),100));
Threshold_parallel = 15;
Threshold_Trend = 0.001*per;
SLabs = SL-Ref(SL,-1); RLabs = RL-Ref(RL,-1);
ROC2SL = (SLabs/C)*100; ROC2RL = (RLabs/C)*100;
RSL = ROC2SL > Threshold_Trend; FlatSL = abs(ROC2SL) < Threshold_Trend; FSL = ROC2SL < -Threshold_Trend;
RRL = ROC2RL > Threshold_Trend; FlatRL = abs(ROC2RL) < Threshold_Trend; FRL = ROC2RL < -Threshold_Trend;
parallel= abs(((RocSL/RocRL)-1)*100)<Threshold_parallel;
UT= RSL AND RRL AND parallel;
DT= FSL AND FRL AND parallel;
DT_UT = IIf (DT,-1,IIf(UT,1,0));
Range = parallel AND FlatSL AND FlatRL;
Xm = xb-xa >4 & xd-xc >4; //x-min.distance - optional
AscT= FlatRL & RSL;// & xa<xd & xc<xb;// & Xm;
DscT= FlatSL & FRL;// & xa<xd & xc<xb;// & Xm;
AT_DT= IIf(AscT,1,IIf(DscT,-1,0));
ST = RSL & FRL & RL>SL;//& xa<xd & xc<xb;// & Xm;
ET = RRL & FSL & RL>SL;//& xa<xd & xc<xb;// & Xm;//abs(ROCSL/ROCRL)<3 - optional
ST_ET = IIf(ST,1,IIf(ET,-1,0));
RW = RRL & RSL & RocSL>RocRL & SL>RL AND NOT parallel;// & Xm;
FW = FSL & FRL & RocRL<RocSL & SL<RL AND NOT parallel;// & Xm;
RW_FW = IIf (RW,1,IIf(FW,-1,0));
Distance = 0.5*ATR(14);
//Support line signals
Sup_break = Cross(SL,C) & X>XB;
Sup_pricejustabove = L<SL+Distance & L>SL & X>XB;
Sup_confirmed = L<=SL & C>SL & X>XB;
//Resistance line signals
Res_break = Cross(C,RL) & X>XD;
Res_pricejustbelow = H>RL-Distance & H<RL & X>XD;
Res_confirmed = H>=RL & C<RL & X>XD;
//Parallel lower line signals
PLL_break = Cross(PLL,C);
PLL_pricejustabove = L<PLL+Distance & L>PLL;
PLL_confirmed = L<=PLL & C>PLL;
//Parallel higher line signals
PHL_break = Cross(C,PHL);
PHL_pricejustbelow = H>PHL-Distance & H<PHL;
PHL_confirmed = H>=PHL & C<PHL;
SupSignals = Sup_break | Sup_pricejustabove | Sup_confirmed;
ResSignals = Res_break | Res_pricejustbelow | Res_confirmed;
PLLSignals = PLL_break | PLL_pricejustabove | PLL_confirmed;
PHLSignals = PHL_break | PHL_pricejustbelow | PHL_confirmed;
//BS = Sup_confirmed OR Res_break;
//SS = Res_confirmed OR Sup_break;
BS = Sup_confirmed OR Sup_pricejustabove OR Res_break;
SS = Res_confirmed OR Res_pricejustbelow OR Sup_break;
NS = Sup_pricejustabove OR Res_pricejustbelow;
PatternDirection =
IIf(AscT|FW|UT,1,
IIf(DscT|RW|DT,-1,
IIf(ST|ET|Range,0,0)));
PatternText =
WriteIf(LastValue(AscT),"Ascending Triangle",
WriteIf(LastValue(DscT),"Decending Triangle",
WriteIf(LastValue(ST),"Symmetrical Triangle",
WriteIf(LastValue(ET),"Expanding Triangle",
WriteIf(LastValue(RW),"Rising Wedge",
WriteIf(LastValue(FW),"Falling Wedge",
WriteIf(LastValue(UT),"Up Channel",
WriteIf(LastValue(DT),"Down Channel",
WriteIf(Range,"Range","Not defined")))))))));
//Display Cond. fix when Chart is compl.zoomed out
PLLd = abs((LastValue(C)/LastValue(PLL))-1)<0.01*DisRange;
PHLd = abs((LastValue(C)/LastValue(PHL))-1)<0.01*DisRange;
barvisible = Status("barvisible");
firstvisiblebar = barvisible & NOT
Ref(barvisible,-1);
HHvisible = LastValue(HighestSince(firstvisiblebar,High));
LLvisible = LastValue(LowestSince(firstvisiblebar,Low));
RaH = HHvisible *1.05; //Range High
RaL = LLVisible *0.95; //Range Low
//Anyline_zero
AnZ= ya==0 OR yb==0 OR yc==0 OR yd==0;
SL_plot = IIf(x>=xa & SL>RaL & SL<RaH & NOT AnZ,SL,IIf(x>=xa & RaL==0 & NOT AnZ,SL,-1e10));
RL_plot = IIf(x>=xc & RL>RaL & RL<RaH & NOT AnZ,RL,IIf(x>=xc & RaL==0 & NOT AnZ,RL,-1e10));
PLL_plot = IIf(x-x2>=0 & abs(LastValue(L/PLL)-1) <abs(LastValue((DisRange/1000)*ATR(14))) & PLL>RaL & PLL<RaH & NOT AnZ,PLL,IIf(x-x2>=0 & RaL==0 & PLLd & abs(LastValue(L/PLL)-1) <abs(LastValue((DisRange/1000)*ATR(14)))& NOT AnZ,PLL,-1e10));
PHL_plot = IIf(x-x3>=0 & abs(LastValue(H/PHL)-1) <abs(LastValue((DisRange/1000)*ATR(14))) & PHL>RaL & PHL<RaH & NOT AnZ,PHL,IIf(x-x3>=0 & RaL==0 & PHLd & abs(LastValue(H/PHL)-1) <abs(LastValue((DisRange/1000)*ATR(14)))& NOT AnZ,PHL,-1e10));
///////////Begin Ploting Part////////////
LastBar = Cum(1) == LastValue(Cum(1));
Plot(SL_plot ," SL" ,Color_SL,Style_SL+styleNoTitle);
Plot(RL_plot ," RL" ,Color_RL,Style_RL+styleNoTitle);
Plot(IIf(Parallellinesswitch,PLL_plot,-1e10)," PLL",Color_PLL,Style_PLL+styleNoTitle);
Plot(IIf(Parallellinesswitch,PHL_plot,-1e10)," PHL",Color_PHL,Style_PHL+styleNoTitle);
// Shading
BEGIN=Min(xa,xc);
TRS = IIf(x>BEGIN-1,SL,-1e10);
TRR = IIf(x>BEGIN-1,RL,-1e10);
trr = IIf(trr>0,trr,Null);
yVal=IIf(trs > trr,trr,trs);
yval = IIf(yval>0,yval,Null);
GraphZOrder = 0;
if(Version()>4.75){
PlotOHLC(0,trr,yval,0,"",Shadowcolor,styleCloud+styleNoLabel);}
else
{
Plot(yVal,"",Backgroundcolor,styleArea+styleNoRescale+styleNoLabel);
Plot(trr,"",Shadowcolor,styleArea+styleNoRescale+styleNoLabel);
}
///////////End Ploting Part////////////
DefinedPatterns = AscT | DscT | ST | ET | RW | FW | UT | DT;
Filter = BarIndex()==LastValue(BarIndex()) AND NOT GroupID()==253;
Filter = Filter AND
(AscT AND AscTs)| (DscT AND DscTs)| (ST AND STs)|
(ET AND ETs)| (RW AND RWs)| (FW AND FWs)|
(UT AND UTs)| (DT AND DTs)|(Range AND Ranges)|
(SupSignals AND NonDefinedPatterns AND NOT DefinedPatterns)|
(ResSignals AND NonDefinedPatterns AND NOT DefinedPatterns);
// | PLLSignals | PHLSignals | Trade Variables
Red=C<O;
Green=C>O;
Buy = FW | UT;
//Buy=Buy1 & !Ref(Buy1,-1);
Short = RW | DT;
//Short = Short1 & !Ref(Short1,-1);
Buy1=BarsSince(Buy);
Short1=BarsSince(Short);
BuyPrice=(round(ValueWhen(Buy,C)*10))/10;
ShortPrice=(round(ValueWhen(Short,C)*10))/10;
Buystop=(round((BuyPrice-(BuyPrice*0.5/100))*10))/10;
Shortstop=(round((ShortPrice+(ShortPrice*0.5/100))*10))/10;
Buystop1=((Cross(Buystop,C) OR Cross(Buystop,L)) AND since) ;
Shortstop1=((Cross(H,Shortstop) OR Cross(C,Shortstop)) AND since);
Sell1=(Buy1>0 AND ((CCI(14)<Ref(CCI(14),-1) AND Red) OR (x==xd & NOT AnZ)) AND since);
Sell=Sell1 AND NOT Ref(Sell1,-1);
Cover1=(Short1>0 AND ((CCI(14)>Ref(CCI(14),-1) AND Green) OR (x==xb & NOT AnZ)) AND since);
Cover= Cover1 AND NOT Ref(Cover1,-1);
SellPrice=(round(ValueWhen(Sell,C)*10))/10;
CoverPrice=(round(ValueWhen(Cover,C)*10))/10;
Buy11=Cum(Buy);
Short11=Cum(Short);
//Indicator
if( Status("action") == actionIndicator )
(
Title = EncodeColor(colorLightBlue)+ "" +"\n"+EncodeColor(colorYellow)+ Name() + " - " + EncodeColor(colorYellow)+ Interval(2) + EncodeColor(colorWhite) +
" - " + Date() +" - " +EncodeColor(colorYellow) + " TurnOver= Rs. "+EncodeColor(colorWhite)+ WriteVal((((V*C)/100000)),1.2)+" Lakhs - "+
"\n"+
WriteIf(LastValue(AscT),"Ascending Triangle - bullish formation that usually forms during an uptrend as a continuation pattern"+"","")+
WriteIf(LastValue(DscT),"Decending Triangle - bearish formation that usually forms during a downtrend as a continuation pattern."+"","")+
WriteIf(LastValue(ST),"Symmetrical Triangle - mark important trend reversals, they more often mark a continuation of the current trend - direction of the next major move can only be determined after a valid breakout."+"","")+
WriteIf(LastValue(ET),"Expanding Triangle - The expanding triangle is said to be a good indicator of a reversal pattern"+"","")+
WriteIf(LastValue(RW),"Rising Wedge - rising wedges definitely slope up and have a bearish bias"+"","")+
WriteIf(LastValue(FW),"Falling Wedge - falling wedges definitely slope down and have a bullish bias."+" ","")+
WriteIf(LastValue(UT),"Up Channel - Bullish Trend"+"","")+
WriteIf(LastValue(DT),"Down Channel - Bearish Trend"+"","")+
"\n"+
WriteIf(Sup_pricejustabove,EncodeColor(colorBrightGreen)+"Price just above Support",
WriteIf(Sup_confirmed,EncodeColor(colorBrightGreen)+"Support Confirmed",EncodeColor(colorWhite)+""))+
WriteIf(Sup_break,EncodeColor(colorRed)+"Support Break"+"","")+"\n"+
WriteIf(Res_pricejustbelow,EncodeColor(colorRed)+"Price just below Resistance",
WriteIf(Res_confirmed,EncodeColor(colorRed)+"Resistance Confirmed",EncodeColor(colorWhite)+""))+
WriteIf(Res_break,EncodeColor(colorBrightGreen)+"Resistance Break"+"","")+"\n"+
EncodeColor(colorBrightGreen) +
WriteIf(BuyPrice, "BUY: "+(BuyPrice)+" ","")+
WriteIf(BuyStop, " - BUY SL: "+(BuyStop),"")+
WriteIf(SellPrice , " - BUY TP: "+(SellPrice)+" ","")+
"\n"+
EncodeColor(colorRed) +
WriteIf(ShortPrice, "SHORT: "+(ShortPrice)+" ","")+
WriteIf(ShortStop, "- SHORT SL: "+(ShortStop)+" ","")+
WriteIf(CoverPrice, " - SHORT TP: "+(CoverPrice)+" ","")+"\n"+
"\n"+
WriteVal(Buy11)+ WriteVal(Short11)+WriteVal(LastValue(Buy))+ WriteVal(LastValue(Short))+
WriteIf(Range,"Range","Not defined"));
//Shapes
if(PlotP1P2){
PlotShapes(IIf(x==xa & NOT AnZ,P1Shape,shapeNone),Color_SL,0,SL,-13 );
PlotShapes(IIf(Buy,shapeUpArrow,shapeNone),Color_SL,0,SL,-25 );
PlotShapes(IIf(x==xc & NOT AnZ,P1Shape,shapeNone),Color_RL,0,H,13 );
PlotShapes(IIf(Short,shapeDownArrow,shapeNone),Color_RL,0,H,-25 );
}
PlotShapes(IIf(Buystop1,shapeCircle,shapeNone),Color_SL,0,SL,-13 );
PlotShapes(IIf(Cover,shapeUpTriangle,shapeNone),Color_RL,0,SL,-45 );
PlotShapes(IIf(Shortstop1,shapeCircle,shapeNone),Color_RL,0,H,-13 );
PlotShapes(IIf(Sell,shapeDownTriangle,shapeNone),Color_SL,0,H,-45 );
//money management
lotSizeb = round((riskAmount/(BuyPrice-BuyStop)));
lotSizes = round((riskAmount/(ShortStop-ShortPrice)));
//Explorer
AddColumn( IIf(Buy, 66, IIf(Short, 83,01 )), "GO", formatChar, colorWhite, bkcolor= IIf(Short,colorDarkRed,colorDarkGreen) );
AddColumn( IIf(Sell, 80, IIf(Cover, 80,01 )), "PR", formatChar, colorWhite, bkcolor= IIf(Cover ,colorDarkRed,colorDarkGreen) );
AddColumn( IIf(buystop1, 76, IIf(shortstop1, 76,01 )), "SL", formatChar, colorWhite, bkcolor= IIf(shortstop1 ,colorDarkRed,colorDarkGreen) );
AddColumn( IIf(Buy OR Buystop1 OR Sell, BuyPrice, IIf(Short OR shortstop1 OR Cover, ShortPrice,01 )), "ENTRY@", 1.2, colorWhite, bkcolor= IIf(Short OR Shortstop1 OR Cover,colorDarkRed,colorDarkGreen) );
AddColumn( IIf(Buy OR Buystop1 OR Sell, BuyStop, IIf(Short OR Shortstop1 OR Cover, ShortStop,01 )), "STPLS@", 1.2, colorWhite, bkcolor= IIf(Short OR Shortstop1 OR Cover,colorDarkRed,colorDarkGreen) );
AddColumn( IIf(Buy OR Buystop1 OR Sell, SellPrice, IIf(Short OR Shortstop1 OR Cover, CoverPrice,01 )), "PR@", 1.2, colorWhite, bkcolor= IIf(Short OR Shortstop1 OR Cover,colorDarkRed,colorDarkGreen) );
AddColumn( IIf(Buy OR Buystop1 OR Sell, Lotsizeb, IIf(Short OR Shortstop1 OR Cover, Lotsizes,01 )), "QTY", 1.0, colorWhite, bkcolor= IIf(Short OR Shortstop1 OR Cover,colorDarkRed,colorDarkGreen) );
AddTextColumn(
WriteIf(Sup_pricejustabove,"Price just above",
WriteIf(Sup_confirmed,"Confirmed",
WriteIf(Sup_break,"Break",""))),"Support Line",1.2,
IIf(Sup_pricejustabove OR sup_confirmed,colorGreen,colorRed));
AddTextColumn(
WriteIf(Res_pricejustbelow,"Price just below",
WriteIf(Res_confirmed,"Confirmed",
WriteIf(Res_break,"Break",""))),"Resistance Line",1.2,
IIf(Res_pricejustbelow OR Res_confirmed,colorRed,colorGreen));
patterncolor =
IIf(AscT|FW|UT,colorGreen,
IIf(DscT|RW|DT,colorRed,
IIf(ST|ET|Range,colorBlue,colorBlack)));
AddTextColumn(PatternText,"Pattern",0,patterncolor );
AddTextColumn(FullName(),"Full name");
AddTextColumn(
WriteIf(PLL_pricejustabove,"price just above",
WriteIf(PLL_confirmed,"confirmed",
WriteIf(PLL_break,"break",""))),"Parallel support line");
AddTextColumn(
WriteIf(PHL_pricejustbelow,"price just below",
WriteIf(PHL_confirmed,"confirmed",
WriteIf(PHL_break,"break",""))),"Parallel resistance line");
//Alerts
AlertIf( Buy, "SOUND C:\\Windows\\Media\\Windows XP Startup.wav", "Buy",2);
AlertIf( Short, "SOUND C:\\Windows\\Media\\Windows XP Startup.wav", "Short", 2 );
AlertIf( BuyStop1, "SOUND C:\\Windows\\Media\\Ringin.wav", "BuyStop Hit", 2 );
AlertIf( Sell, "SOUND C:\\Windows\\Media\\Ringin.wav", "Buy Take Profit", 2 );
AlertIf( ShortStop1, "SOUND C:\\Windows\\Media\\Ringin.wav", "Short Stop Hit", 2 );
AlertIf( Cover , "SOUND C:\\Windows\\Media\\Ringin.wav", "Short Take Profit", 2 );
//Filters
Filter= Buy OR Short OR Buystop1 OR Shortstop1 OR Sell OR Cover;